

Open Interest in Crypto: Trend Analysis Guide | Complete 2026 Explainer

Open interest in crypto is the total number of outstanding derivative contracts — futures or perpetual swaps — that have not been settled or closed at any given point in time. Every open contract represents two parties: one long and one short. Both sides are active, both sides are exposed to market risk.
When a new buyer and a new seller enter a futures contract together, open interest in crypto increases by one. When a trader closes their position — by taking the opposite side of their original trade — open interest decreases. If an existing long sells to a new buyer, open interest stays the same, because the total number of open contracts has not changed.
This distinction is what makes open interest in crypto fundamentally different from trading volume. Volume counts every transaction. Open interest counts only what is still open — the live exposure that remains in the market after all the buying and selling is done.

For any trader who participates in crypto futures or perpetual markets, open interest in crypto is one of the most powerful and underutilised analytical tools available. It tells you not just that activity is occurring, but whether that activity is creating new positions or simply recycling existing ones.
View this profile on Instagram
Why Open Interest in Crypto Matters — The Signal Behind the Number
Price tells you where the market cleared. Volume tells you how much activity occurred. But open interest in crypto tells you something neither of those metrics can — how much conviction is actually standing behind the current price level.
A price move accompanied by rising open interest means new money is flowing into the market in the direction of that move. New buyers or new sellers are committing capital at the current price — suggesting the move has genuine participation and may continue.
A price move accompanied by falling open interest in crypto means existing positions are being closed — traders are exiting rather than entering. This type of move is structurally weaker and more likely to reverse, because it is not attracting fresh directional commitment.

This is why professional traders and analysts track crypto futures open interest alongside price and volume — it provides the third dimension of market analysis that the other two metrics cannot supply on their own.
Open Interest vs Volume in Crypto — Understanding the Difference
The most common source of confusion for traders new to open interest in crypto is the distinction between open interest and trading volume. They measure entirely different things — and confusing them leads to misreading market conditions.
Trading volume counts the total number of contracts traded during a specific period. It resets to zero at the start of each new period. If the same contract is bought and sold five times in one day, that counts as five units of volume — but open interest may not have changed at all.
Open interest in crypto is cumulative and continuous. It reflects the total number of contracts that are currently open — not how many times contracts changed hands. It only increases when new contracts are created and only decreases when existing contracts are closed or settled.
| Metric | What It Measures | Resets? | What It Tells You |
|---|---|---|---|
| Open Interest (OI) | Total outstanding contracts right now | No — cumulative | How much conviction is in the market |
| Volume | Contracts traded in a period | Yes — per period | How much activity occurred |
| Price | Where the last trade cleared | Continuous | Market equilibrium at a moment |
Both metrics are useful — but they answer different questions. Volume tells you if a market is active. Open interest in crypto tells you if that activity is building new positions or unwinding existing ones. Used together, they give a much more complete picture than either metric alone.
How Open Interest in Crypto Changes — The Four Scenarios
Understanding exactly when and how open interest in crypto increases or decreases helps traders interpret the data accurately rather than drawing incorrect conclusions from surface-level changes.
OI increases when a new buyer and a new seller enter the market together — creating a new open contract. Both parties are establishing fresh directional exposure. This is bullish for the sustainability of the current price move — it indicates participation is building.
OI stays the same when an existing position holder trades with a new participant — one side is closing, the other is opening. The total number of open contracts does not change because the closure of one position is offset by the opening of another.
View this profile on Instagram
OI decreases when two existing position holders trade with each other — both sides are closing. A long sells to a short — and both positions are netted out. The total number of open contracts falls. This indicates the market is unwinding rather than building new positions.
In crypto markets, open interest in crypto can also fall sharply during liquidation events — when forced position closures sweep through the market as leveraged traders hit their liquidation prices simultaneously. These OI drops are typically associated with sharp, fast price moves in the direction of the liquidation cascade.
Reading the OI Indicator in Crypto — 4 Key Combinations
The most powerful way to use open interest in crypto as an analytical tool is to read it in combination with price direction. The relationship between rising/falling OI and rising/falling price generates four distinct signals — each with a different implication for market direction.
Rising Price + Rising Open Interest — Bullish Confirmation
When price rises and open interest in crypto rises simultaneously, it is the most bullish combination. New money is flowing into the market on the long side — fresh buyers are committing capital at the current price, and the uptrend is being supported by genuine new participation.
This is a trend confirmation signal. The move is likely to continue because it is not just technical momentum — it is backed by real new positions being established at progressively higher prices.
Rising Price + Falling Open Interest — Weak Rally (Short Covering)
When price rises but open interest in crypto falls, the rally is being driven by short position closures rather than new long entries. Shorts are covering — buying to close their positions — which pushes price up, but without new longs entering to replace them.
This is a structurally weak rally. Once the short covering is exhausted, there is no fresh buying pressure to sustain the upward move. Price advances driven primarily by short covering tend to retrace more quickly than those driven by genuine new long accumulation.
Falling Price + Rising Open Interest — Bearish Confirmation
When price falls and open interest in crypto rises simultaneously, new money is flowing into short positions. Fresh sellers are committing capital at lower and lower prices — confirming that the downtrend has genuine participation behind it.
This is a trend confirmation signal for bearish momentum. The downside move is supported by real new positions, not just technical selling — and is likely to continue until the OI trend reverses.
Falling Price + Falling Open Interest — Weak Decline (Long Liquidation)
When price falls and open interest in crypto also falls, the decline is being driven by long position closures rather than new short entries. Longs are exiting — selling to close their positions — which pushes price down, but shorts are not building aggressively into the move.
This is typically a healthier, more sustainable type of decline than a cascading short-driven selloff. Once the long liquidation pressure exhausts itself, there may be less downside follow-through because fresh short positioning has not been established to drive further decline.
| Price Direction | OI Direction | Signal | Likely Driver |
|---|---|---|---|
| Rising ↑ | Rising ↑ | Bullish confirmation | New longs entering — strong trend |
| Rising ↑ | Falling ↓ | Weak rally | Short covering — may not sustain |
| Falling ↓ | Rising ↑ | Bearish confirmation | New shorts entering — strong downtrend |
| Falling ↓ | Falling ↓ | Weak decline | Long liquidation — exhaustion possible |
High Open Interest in Crypto — What It Means and Why It Matters
When open interest in crypto reaches extreme highs — either for a specific asset or across the broader derivatives market — it is a signal that deserves careful attention. High OI means the market is heavily leveraged and deeply committed to the current directional narrative.
Historically, periods of Bitcoin open interest all-time highs have preceded major volatility events — often in the form of large-scale liquidation cascades. When OI is extremely elevated, the market is fragile. A relatively modest adverse price move can trigger a chain reaction of liquidations — as leveraged positions hit their liquidation prices, forced selling pushes price further in the adverse direction, triggering more liquidations in a self-reinforcing cascade.
This is why many experienced crypto traders reduce position sizes and tighten risk management when crypto futures open interest reaches historically elevated levels. The risk is not just that the price will move against them — it is that the resulting move will be amplified by mass liquidations beyond what fundamental conditions would justify.
📊 High OI Scenario — Bitcoin Example
Context: BTC price at $70,000. Total BTC futures open interest: $35 billion (near ATH).
Market condition: Market heavily leveraged long. Funding rates strongly positive.
Trigger: Negative macro news causes BTC to drop 5% to $66,500.
What happens: Overleveraged longs begin hitting liquidation prices. Forced selling pushes price to $64,000. More liquidations triggered. Price overshoots to $62,000 — well below fundamental support.
OI after event: Falls sharply as leveraged positions are wiped out.
Key lesson: High OI amplified a 5% move into a 11% crash. The OI level, not the catalyst, determined the magnitude.
Open Interest and Price Divergence in Crypto — A Powerful Warning Signal
One of the most actionable signals generated by open interest in crypto is divergence — when price and open interest move in opposite directions for a sustained period.
Bearish OI divergence occurs when price continues to make new highs while open interest in crypto is declining or stagnating. This indicates that the rally is being driven by position closures — shorts covering, longs taking profit — rather than fresh conviction buying. It is a warning that the uptrend may be losing its structural support.
Bullish OI divergence occurs when price makes new lows while open interest in crypto is declining. This suggests the downtrend is being driven by long liquidations rather than fresh short selling. When OI falls along with price, the bearish pressure is self-exhausting — and a reversal may be closer than price action alone suggests.
Divergence signals from open interest in crypto are most reliable when confirmed by other indicators — particularly the funding rate, trading volume, and key technical levels. They are warnings to reassess, not automatic signals to enter.
Open Interest in Crypto as a Market Sentiment Indicator
Beyond trend analysis, open interest in crypto serves as one of the most direct measures of market sentiment and leverage available to any trader.
Rising crypto futures open interest across the entire market — not just a single asset — indicates that the derivatives market is becoming more leveraged overall. More capital is being committed to directional bets. This is typically associated with increasing market conviction in the prevailing trend — but also with increasing systemic fragility, as higher overall OI means larger potential liquidation cascades if the trend reverses.
Falling open interest in crypto across the entire market suggests deleveraging — traders are closing positions, reducing risk, and moving to the sidelines. This is often seen during periods of uncertainty or after large liquidation events. While falling OI can signal weakness, it can also be a healthy reset — reducing the leverage overhang that makes markets vulnerable to sharp cascading moves.
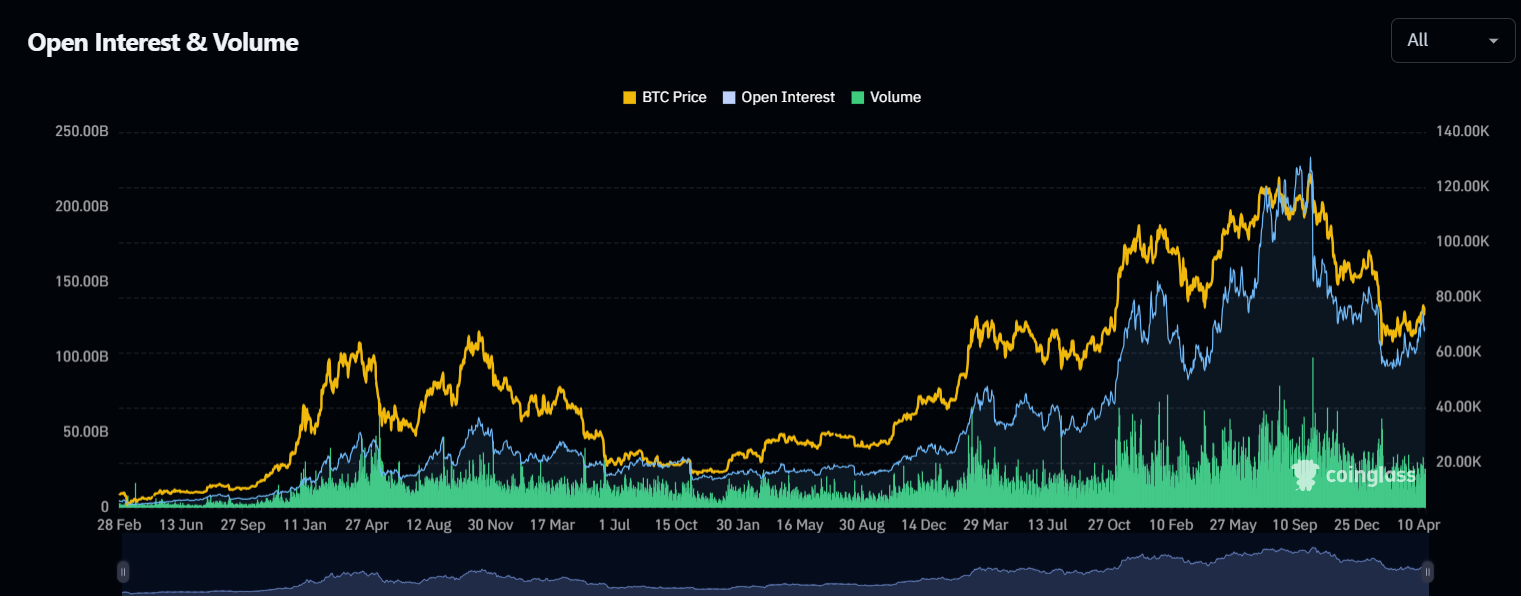
Professional traders monitor aggregate OI in crypto across exchanges using platforms like CoinGlass, which shows total open interest in USD terms across Binance, Bybit, OKX, CME, and all other major venues simultaneously — giving a complete picture of the entire derivatives market’s positioning at any moment.
How to Read Open Interest Crypto Charts — Step by Step
Reading open interest in crypto charts effectively requires understanding what you are looking at and what timeframe is most relevant for your analysis.
Most platforms — including CoinGlass, Coinalyze, and exchange-native analytics tools — display crypto open interest as a chart overlaid below the price chart, showing OI in either contract units or USD notional value. USD notional value is generally more useful because it accounts for changes in the asset’s price — preventing you from mistaking a price-driven OI increase (same number of contracts, higher dollar value) for a genuine new position build.
When analysing open interest in crypto charts, look for these specific patterns:
- Gradual OI build during a trend: Steady, consistent growth in OI alongside a price trend confirms that new participants are entering — the trend has structural support.
- Sharp OI spike followed by rapid decline: A sudden OI surge followed by an equally rapid collapse typically indicates a liquidation cascade — leveraged positions were opened and then immediately wiped out by volatility.
- OI plateau near price extremes: When OI stops growing despite continued price appreciation, it signals that fewer new participants are entering at elevated levels — a warning that momentum may be waning.
- OI collapse without corresponding price collapse: If OI falls sharply but price holds — or even rises — it indicates that shorts are being liquidated (short squeeze) rather than longs closing. This is typically a bullish signal.
Best Tools to Track Open Interest in Crypto — 2026
Tracking open interest in crypto accurately requires tools that aggregate data across all major exchanges — because OI data from a single exchange gives an incomplete and potentially misleading picture of overall market positioning.
| Tool | Best For | Key Feature | Cost |
|---|---|---|---|
| CoinGlass | Comprehensive OI tracking | Cross-exchange OI, liquidation data, heatmaps | Free (premium available) |
| Coinalyze | Detailed per-exchange OI charts | OI overlaid on price charts, funding rate | Free (premium available) |
| The Block | Institutional-grade aggregated data | Historical OI trends, CME data included | Free (some paid) |
| TradingView | Charting with OI indicators | OI indicators overlaid on price charts | Free (premium available) |
| CoinMarketCap | Quick OI overview by asset | Derivatives market dashboard | Free |
CoinGlass is the most widely used tool for crypto futures open interest analysis among professional traders. Its liquidation heatmap — which shows where the largest concentrations of liquidation levels are clustered around the current price — is particularly powerful when used alongside open interest data to identify levels where large position closures are likely to occur.
Open Interest in Crypto and Liquidation Cascades — The Critical Connection
The relationship between open interest in crypto and liquidation events is one of the most practically important dynamics for any crypto derivatives trader to understand.
Liquidation cascades occur when a price move forces one group of leveraged traders to their liquidation price. Their positions are automatically closed by the exchange — creating forced buying or selling in the direction of the move. This pushes price further, triggering the next layer of liquidations, which pushes price further still — creating a self-reinforcing cascade that can move markets 10% to 30% in minutes.
The severity of any liquidation cascade is directly proportional to the level of open interest in crypto that existed before it began. Higher OI means more leveraged positions are at risk — and when those positions unwind simultaneously, the resulting price impact is correspondingly larger.
Monitoring crypto futures open interest before major events — macroeconomic data releases, regulatory announcements, technical breakout levels — allows traders to assess how vulnerable the market is to a cascade. High OI at a technically significant level means any break of that level could trigger a much larger-than-normal move.
FAQs — Open Interest in Crypto
What is open interest in crypto?
Open interest in crypto is the total number of outstanding derivative contracts — futures or perpetual swaps — that are currently open and have not been settled or closed. It represents the total live exposure in the market. Every open contract has one long and one short counterparty. OI increases when new positions are created and decreases when existing positions are closed.
What does rising open interest in crypto mean?
Rising open interest in crypto means new money is entering the derivatives market — new long or short positions are being established. When rising OI accompanies rising price, it is a bullish trend confirmation signal. When rising OI accompanies falling price, it confirms a bearish downtrend. In both cases, rising OI indicates that the move has genuine new participation behind it.
What is the difference between open interest and volume in crypto?
Volume counts how many contracts were traded during a specific period — it resets regularly. Open interest in crypto measures how many contracts are still open right now — it is cumulative. Volume shows activity. OI shows how much conviction is still standing after all the activity. Both are important, but they answer fundamentally different questions about market conditions.
What does high open interest in crypto mean?
High open interest in crypto means the market is heavily leveraged — a large number of futures contracts are open relative to the asset’s spot market size. While high OI can indicate strong directional conviction, it also increases systemic fragility. If price moves adversely, the potential for a large liquidation cascade is greater — which is why experienced traders are more cautious about adding new leveraged positions when OI is at historical extremes.
How do I track open interest in crypto?
The most reliable tool for tracking open interest in crypto across all major exchanges is CoinGlass (coinglass.com). It aggregates OI data from Binance, Bybit, OKX, CME, and dozens of other platforms — displaying total OI in USD terms, historical OI charts, and liquidation level data in real time. Coinalyze and The Block are also excellent options for more detailed or historical OI analysis.
Can open interest predict price direction in crypto?
Open interest in crypto does not predict price direction on its own — but it significantly improves the quality of trend analysis when used alongside price and volume. The four OI/price combinations — rising OI with rising price, falling OI with rising price, rising OI with falling price, and falling OI with falling price — each provide meaningful context about the likely sustainability and drivers of the current price move.
Final Takeaway — Mastering Open Interest in Crypto Analysis
Open interest in crypto is the metric that separates sophisticated market analysis from surface-level price watching. Price tells you what happened. Volume tells you how active the market was. But only open interest tells you whether the participants who drove that move are still in the market — and whether new participants are committing capital behind the current trend.
Add OI in crypto to every piece of market analysis you do. Before entering a leveraged trade, check whether OI is rising or falling in the direction of your bias. Before sizing up a position, check whether aggregate market OI is at historically elevated levels. And when you see a large price move, always ask: is OI rising or falling? The answer tells you far more about the quality and sustainability of that move than the price chart alone ever can.
Your Action Step: Open CoinGlass today and look at Bitcoin’s open interest chart for the past 90 days. Overlay it against BTC price. Identify the periods where OI rose with price, fell with price, or diverged from price. Ask yourself what each combination signalled — and whether the subsequent price action confirmed it. This exercise alone will sharpen your market analysis significantly.