

What Is Currency Correlation and 4 Real Case Study

Currency correlation measures how consistently two currency pairs move in relation to each other, whether they rise and fall together, move in opposite directions, or move independently. It is expressed as a number between -1 and +1.
- +1.0 — pairs move together perfectly, 100% of the time
- -1.0 — pairs move in opposite directions perfectly
- 0 — no relationship; movements are independent
In practice, a correlation above +0.70 is considered strongly positive, below -0.70 is strongly negative, and between -0.40 and +0.40 is effectively uncorrelated for trading purposes.
Why this matters immediately: If you are long EUR/USD and long GBP/USD simultaneously and their correlation is +0.90 — you are not trading two positions. You are trading one big position with double the risk and double the margin. Most beginners discover this only after both trades lose at the same time.
Currency Correlation Reference Table — Major Pairs
| Pair 1 | Pair 2 | Typical Correlation | Relationship |
|---|---|---|---|
| EUR/USD | GBP/USD | +0.85 to +0.95 | Strongly Positive — move together |
| EUR/USD | USD/CHF | -0.90 to -0.97 | Strongly Negative — near mirror |
| EUR/USD | USD/JPY | -0.70 to -0.85 | Strongly Negative |
| AUD/USD | NZD/USD | +0.90 to +0.96 | Strongly Positive — move almost identically |
| USD/CAD | USD/CHF | +0.70 to +0.85 | Moderately Positive |
| EUR/USD | AUD/USD | +0.60 to +0.80 | Moderately Positive |
| GBP/USD | USD/JPY | -0.65 to -0.80 | Moderately Negative |
| USD/JPY | USD/CHF | +0.75 to +0.88 | Moderately Positive |
Note: Correlations shift over time based on changing central bank policy divergences, global risk sentiment, and commodity price cycles. Always verify with a live correlation tool before trading on these figures.
Forex Currency Correlation Formula
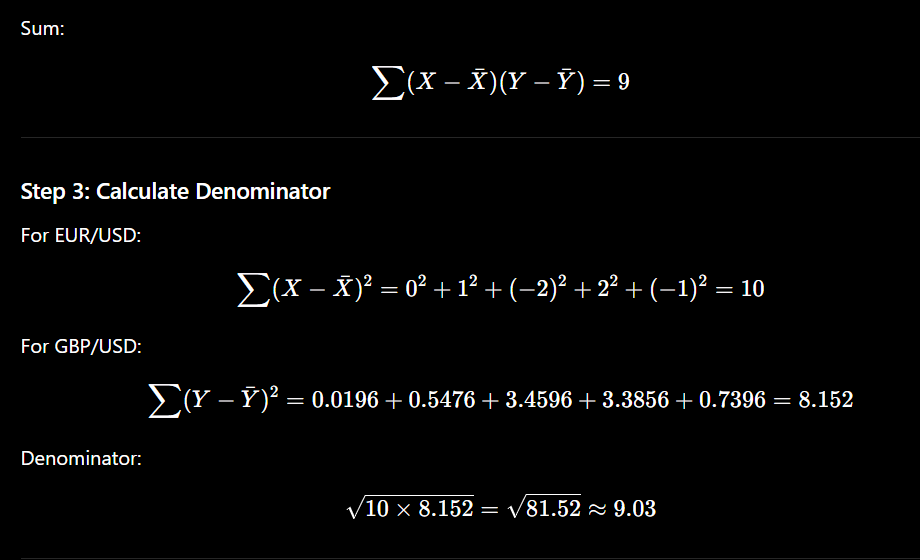
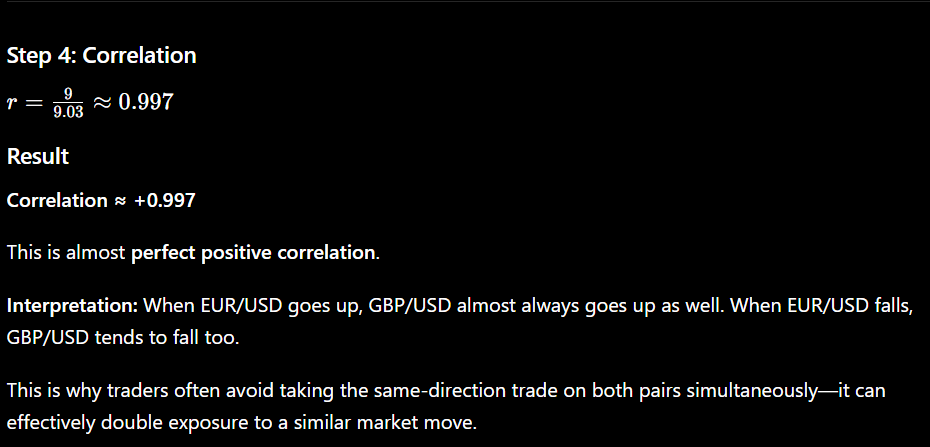
The standard way to measure the relationship between two currency pairs is the Pearson correlation coefficient.
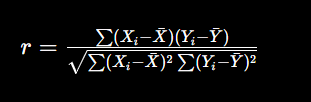
Where:
r = Correlation coefficient
X = Returns of Currency Pair 1 (e.g., EUR/USD)
Y = Returns of Currency Pair 2 (e.g., GBP/USD)
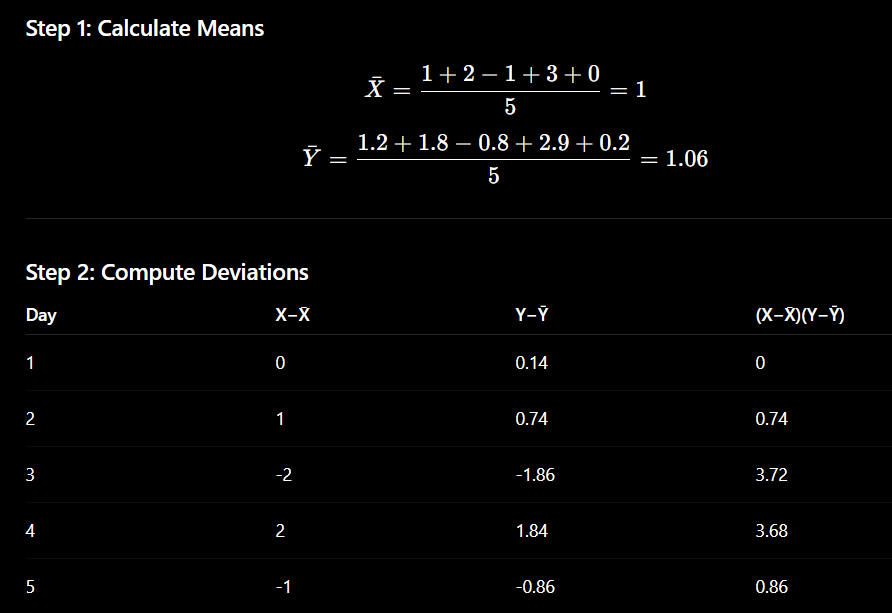
X̄ = Mean of X returns
Ȳ = Mean of Y returns
Correlation Interpretation
| Correlation (r) | Interpretation |
|---|---|
| +1.00 | Perfect positive correlation |
| +0.70 to +0.99 | Strong positive correlation |
| +0.30 to +0.69 | Moderate positive correlation |
| -0.29 to +0.29 | Weak or no correlation |
| -0.30 to -0.69 | Moderate negative correlation |
| -0.70 to -0.99 | Strong negative correlation |
| -1.00 | Perfect negative correlation |
Example
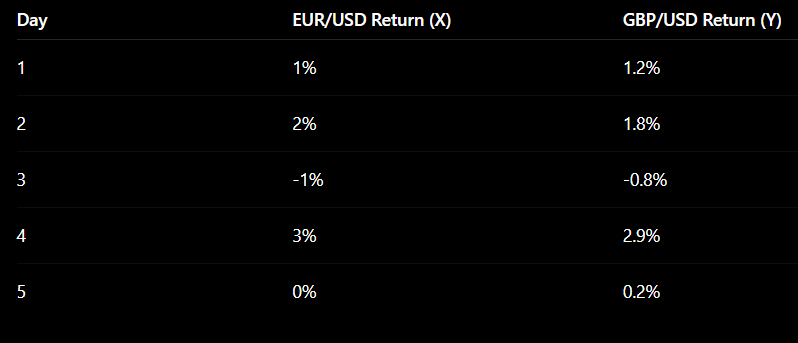
Suppose you calculate the daily returns of:
EUR/USD
GBP/USD
and obtain:
r = 0.89
This indicates a strong positive correlation, meaning the two pairs generally move in the same direction.
If:
r = -0.92
the pairs have a strong negative correlation, meaning they tend to move in opposite directions.
Excel Formula
Most traders calculate correlation using Excel:
=CORREL(A1:A100,B1:B100)
Where:
Column A = Returns of Currency Pair 1
Column B = Returns of Currency Pair 2
Common Forex Correlations
| Pair 1 | Pair 2 | Typical Correlation |
|---|---|---|
| EUR/USD | GBP/USD | Strong Positive |
| EUR/USD | USD/CHF | Strong Negative |
| AUD/USD | NZD/USD | Strong Positive |
| USD/CAD | Crude Oil | Negative Relationship |
| AUD/USD | Gold | Positive Tendency |
Important
Correlation should be calculated using returns (percentage changes) rather than raw price levels. Using returns provides a more accurate measure of how two currency pairs move relative to each other over time.
How Currency Correlation Works in Practice — 4 Real Uses
1. Risk Management — Avoiding Hidden Double Exposure
If EUR/USD and GBP/USD have a +0.90 correlation, trading both long simultaneously gives you ~90% of double risk. Most traders tracking their lot sizes carefully still miss this. The fix: when trading correlated pairs, halve your position size on each — or choose one.
2. Confirmation Trading — Higher Probability Entries
When EUR/USD breaks above a key resistance level, check GBP/USD. If GBP/USD confirms with a simultaneous breakout, the move has multi-pair institutional backing and is significantly more likely to sustain. If GBP/USD does not confirm, treat the EUR/USD breakout with more caution.
3. Hedging — Reducing Directional Exposure
EUR/USD and USD/CHF have a near-perfect -0.95 correlation. Going long EUR/USD while also going long USD/CHF creates a near-neutral position — effectively a hedge. Traders use this when they want to reduce directional risk without closing their primary position and paying the spread twice.
4. Divergence Trading — Spotting Dislocations
When two highly correlated pairs temporarily diverge — one rising while the other stalls or falls — it signals a short-term dislocation. Experienced traders enter the lagging pair in the direction of the leading pair, anticipating convergence. This is one of the cleanest statistical edges available in short-term forex trading.
4 Detailed Case Studies — Indian Traders Using Currency Correlation
📌 Case Study 1 — Arjun Sharma, Indore | The Hidden Double Risk Discovery
Background: Arjun, a 26-year-old software engineer from Indore, had been trading for four months. He was confident in his EUR/USD analysis and typically opened 0.5-lot positions. One Tuesday afternoon, after a particularly clear bullish setup on EUR/USD, he noticed a similar pattern on GBP/USD and opened a 0.5-lot long on that too.
What happened: That evening, the FOMC minutes released hawkish language no one anticipated. Both EUR/USD and GBP/USD dropped 90 pips in 20 minutes. Arjun’s combined loss was ₹11,200 — nearly 18% of his ₹62,000 account. His stop losses on both positions triggered within 4 minutes of each other.
The lesson: Arjun had effectively traded a 1-lot USD short position — double his intended risk. The +0.91 correlation between the pairs meant both responded to the same USD catalyst with almost identical force.
What changed: He now checks correlation before entering any second trade. If correlation with an existing position exceeds +0.75, he either skips the second trade or cuts both positions to 0.3 lots — keeping total correlated exposure at or below 0.6 lots.
✅ Outcome: After implementing correlation-based sizing, his maximum single-session drawdown dropped from 18% to under 4% on equivalent-sized adverse moves.
📌 Case Study 2 — Priya Mehta, Bhopal | Divergence Trade That Generated 87 Pips
Background: Priya, a 31-year-old CA from Bhopal, had studied currency correlation for six weeks after completing her trading program. She monitored AUD/USD and NZD/USD daily — a pair with a typical correlation of +0.93.
The setup: On a Wednesday morning session, Priya noticed that AUD/USD had risen 45 pips from its Asian session low on the back of strong Australian employment data. NZD/USD — which had no New Zealand-specific data that day — had risen only 12 pips. The usual 0.93 correlation implied NZD/USD should have risen roughly 42 pips alongside AUD/USD.
The trade: Priya entered long NZD/USD at 0.6124, targeting 40 pips with a 20-pip stop. Her reasoning: the pair had lagged its highly correlated counterpart without a data-specific reason. The divergence would likely close as NZD/USD caught up. She sized at 0.2 lots.
What happened: Over the next 3.5 hours, NZD/USD rose 87 pips to 0.6211 as the correlation gap closed. Priya exited at her target of 0.6164 for a 40-pip gain, then re-entered at the retest for an additional 22 pips after confirming the trend was extending.
✅ Outcome: 62-pip total gain on a correlation divergence trade. Risk was clearly defined at 20 pips. No macro catalyst needed — the statistical relationship between pairs did the work.
📌 Case Study 3 — Rahul Verma, Jabalpur | Using Negative Correlation to Confirm a Breakout
Background: Rahul, a 28-year-old business owner from Jabalpur, had a consistent problem — he would enter breakout trades on EUR/USD only to get faked out repeatedly. After learning about currency correlation, he added USD/CHF as a confirmation filter.
The logic: EUR/USD and USD/CHF typically have a -0.94 correlation. When EUR/USD breaks above resistance convincingly, USD/CHF should simultaneously break below its corresponding support. If only EUR/USD breaks but USD/CHF holds its support intact, the EUR/USD breakout lacks cross-market confirmation.
The trade: One Thursday, EUR/USD broke above the 1.0880 resistance that had held for three consecutive sessions. Rahul checked USD/CHF — it simultaneously broke below its 0.8942 support. Both pairs confirmed the same USD weakness narrative from different angles. He entered long EUR/USD at 1.0884 with a 25-pip stop.
What happened: EUR/USD extended 78 pips to 1.0962 over the next 6 hours. Rahul exited at 1.0942 — a 58-pip gain — using a trailing stop to protect profits while allowing the move to develop.
✅ Outcome: Dual-pair confirmation reduced his false breakout rate from 52% to roughly 30% over the following two months — a meaningful improvement in win rate without changing his entry technique at all.
📌 Case Study 4 — Neha Tiwari, Ujjain | Hedging an Overnight Position Using Negative Correlation
Background: Neha, a 34-year-old teacher from Ujjain, had a long EUR/USD position (0.3 lots, +65 pips in profit) that she had built over three days. A major NFP release was scheduled for the next morning. She did not want to close the position — her analysis still pointed higher — but holding unhedged through a major release made her uncomfortable.
The hedge: Instead of closing, Neha opened a 0.3-lot long USD/CHF position (which is equivalent to short EUR due to the -0.94 correlation with EUR/USD). This created a near-neutral overnight exposure — if USD strengthened on NFP and crushed EUR/USD, the USD/CHF long would gain proportionally. If USD weakened and EUR/USD extended higher, the USD/CHF position would lose, offset by EUR/USD gains.
What happened: NFP beat expectations significantly. EUR/USD dropped 95 pips. USD/CHF rose 88 pips. Net P&L on the combined position: approximately +3 pips — essentially flat through a 95-pip adverse move.
The morning after: Once the NFP dust settled and her EUR/USD analysis was confirmed intact, Neha closed the USD/CHF hedge at a small profit and let EUR/USD run — which recovered 60 of the 95 pips within 4 hours as the market reread the full jobs report including weak wage data.
✅ Outcome: Protected 65 pips of unrealised profit through a high-risk event without paying the spread on a EUR/USD close. The hedge cost: a 0.5-pip spread on USD/CHF entry and exit. Total cost: approximately ₹240 on 0.3 lots. Insurance value: preserved ₹13,650 of open profit through a 95-pip storm.
FAQs — Currency Correlation in Forex Trading
What is currency correlation in forex?
Currency correlation is a statistical measure of how two currency pairs move in relation to each other, expressed as a coefficient between -1 and +1. A value near +1 means the pairs move together; near -1 means they move in opposite directions; near 0 means they move independently. Traders use it to manage risk, confirm setups, hedge positions, and spot divergence opportunities.
Which currency pairs are most correlated?
The most consistently correlated pairs are EUR/USD and GBP/USD (+0.85 to +0.95), AUD/USD and NZD/USD (+0.90 to +0.96), and EUR/USD and USD/CHF (-0.90 to -0.97 — near perfect inverse correlation). USD/JPY and USD/CHF are also strongly positively correlated (+0.75 to +0.88).
Why do EUR/USD and USD/CHF move in opposite directions?
Both pairs share the USD — but on opposite sides. In EUR/USD, USD is the quote currency (a rising pair means USD weakens). In USD/CHF, USD is the base currency (a rising pair means USD strengthens). When USD weakens, EUR/USD rises and USD/CHF falls simultaneously. This creates the near-perfect negative correlation. Additionally, both EUR and CHF are European currencies subject to similar regional risk sentiment, which amplifies the inverse relationship.
How do I use currency correlation to reduce trading risk?
When two pairs have a correlation above +0.70, treat simultaneous positions in both as a single, larger position. If your normal lot size is 0.5, and you want to trade both EUR/USD and GBP/USD long, reduce each to 0.25 lots — keeping total correlated exposure at your intended 0.5-lot risk level. Never run full-size positions in both without acknowledging the compounded risk.
What is currency correlation divergence and how do I trade it?
Correlation divergence occurs when two highly correlated pairs temporarily decouple — one moves significantly while the other does not. Since the correlation typically reasserts itself over time, traders go long (or short) the lagging pair in the direction of the leading pair, targeting convergence. The trade is statistical, not directional — you are betting that the historical relationship will reassert rather than betting on a specific macro catalyst. See Case Study 2 above for a detailed example.
Does currency correlation change over time?
Yes — significantly. Correlations can shift when central bank policy diverges between the two countries (for example, Bank of Japan maintaining ultra-low rates while the Fed hikes creates unusual JPY behaviour), when commodity prices move dramatically (affecting commodity-linked currencies like AUD, CAD, NZD disproportionately), or during risk-off events when safe-haven flows dominate all other currency relationships. Always use rolling 20-day or 30-day correlation data, not static assumptions. Understanding how central banks influence forex helps anticipate when correlations are likely to shift.
How do I hedge using currency correlation?
Open a position in a negatively correlated pair to partially or fully offset the risk of an existing position. For example, a long EUR/USD position can be hedged by going long USD/CHF (which has approximately -0.94 correlation). If adverse USD news hits EUR/USD, the USD/CHF long gains proportionally, limiting net loss. The hedge is imperfect because correlations are never exactly -1, but it reduces directional exposure significantly — as shown in Neha’s case study above.
Is currency correlation the same as currency co-movement?
They are related but not identical. Co-movement is a general observation that two pairs tend to move together or apart. Correlation is a precise statistical measurement of the strength and consistency of that relationship, calculated from price return data over a specific lookback period (usually 20, 30, or 90 days). Traders should use calculated correlation coefficients rather than relying on general observations of co-movement.
Can I use currency correlation in crypto trading?
Yes. Bitcoin and major altcoins often exhibit high positive correlations during broad market moves — particularly risk-off events. Understanding concepts like crypto market cap and open interest alongside correlation analysis provides a more complete picture of crypto market dynamics. However, crypto correlations are less stable than forex correlations and should be recalculated more frequently.
What is a good currency correlation coefficient for trading?
For risk management purposes, correlations above +0.70 or below -0.70 are considered tradeable — strong enough to have real portfolio implications. Correlations between +0.50 and +0.70 (or -0.50 to -0.70) are moderate — worth noting but not the primary consideration. Correlations between -0.50 and +0.50 are too weak to drive trading decisions reliably and can be treated as functionally uncorrelated for position sizing purposes.
Where can I find live currency correlation data?
Myfxbook’s Currency Correlation tool, Mataf.net, and Investing.com all offer free live currency correlation calculators. Most allow you to set the lookback period (20, 30, 60, 90 days) and see correlation matrices across all major pairs simultaneously. For forex traders using MetaTrader platforms, several free correlation indicator scripts are available in the marketplace that overlay correlation data directly on charts.
Why did two correlated pairs suddenly stop moving together?
This happens when a country-specific event overrides the shared USD factor. For example, if a major UK economic release (like a surprise Bank of England rate decision) hits GBP/USD while EUR/USD is unaffected by European news, the correlation temporarily breaks. Also, if risk sentiment suddenly shifts globally, safe-haven currencies (JPY, CHF) decouple from their usual correlations as capital flows to safety regardless of yield differentials. These temporary divergences often represent tradeable opportunities — as Priya’s case study demonstrated.
Does currency correlation work for swing trading?
Yes, and often more reliably than for short-term scalping. Over longer timeframes (days to weeks), correlations driven by sustained central bank policy divergence or commodity price trends are more consistent. For swing traders monitoring swap rates and multi-day holding costs, using correlation to avoid doubling up on the same macro exposure across multiple positions is particularly valuable because the cumulative risk over several days compounds significantly.
How does understanding currency correlation help with position sizing?
It directly affects how you calculate total portfolio risk. If you have three open long positions — EUR/USD, GBP/USD, and AUD/USD — and their average pairwise correlation is +0.82, your effective position size is not 3 × your per-trade lot size. It is closer to 2.5 × that size because of the shared correlation. Proper lot sizing that accounts for correlation keeps total portfolio exposure within intended risk parameters even when trading multiple pairs simultaneously.
Is currency correlation taught in forex trading courses?
It varies. Most basic trading courses focus on technical analysis and miss currency correlation entirely — which is why many traders only discover it after suffering the exact mistake Arjun made in Case Study 1 above. Comprehensive programs like Bimal Institute’s Crypto & Forex Trading Program cover correlation as part of risk management — because it is a foundational concept that affects every multi-pair portfolio decision a trader makes.
Bimal Institute’s Crypto & Forex Trading Program covers currency correlation, risk management, position sizing, and live market practice under expert mentorship. 1,50,000+ traders trained. 4.9★ rated. Free trading course also available. Enroll at bimalinstitute.com/admission-page or call +91 8889422237.